ьь ы
ыь, ыАьДэАь ььЇ ыА ь ьЅ, ь ьЁ, ыЖьь ъАьэыЅМ эЕэД эьЅыьД ьыЄ. ыАыЉД ъА ыЈъГььь ыЈь ыЙьЉь ъИъВЉэъВ ьЄьДыЄъГ ьыЄ. ьДы ьАыІЌъА ььМыЁ ыЇьДэ ыЏИыь э ыъА ыы эьЄьДыЄ. ъЗИы ыЄыЉД ыАьДэАь ьь эьЌ ьМыЇы ы ъЙ? ьД ыАьДэАы ьДыыЁыЖэА ыььъЙ? ьД ыАьДэАы ь ьЄьэъА?
.png)
ь ыГДэ ьыьь ъАьЅ ьЄьэ ьЇэы ььБ, ььЇ, ь ьЅ, ь ьЁ, ыЖьь ъДэ ь ыГДь ььД ьІъАэы ыЙьЈьДыЄ. ььМыЁы ъБДъАъДыІЌьь ьДьЁ, ьэАэ
ьИыЈМэИ, ъЕыАЉ, ь ьЁАь ьДыЅДъИАъЙьЇ ыЊЈы ъВыЄьД ыАьДэАыЅМ ь ьЉэ ъВьМыЁ ыГээы ъГМь ь ььЁДэъВ ыыЄ. ъЗИыІЌъГ ьЄыы ь ыГДы ыЊЈы эъГМ ыЖ(wealth), ъЗИыІЌъГ ыГДьь ъИАьДъА ыыЄ. ьыЇы 20ьИъИА ьЄыА ьДэ ъАьЅ ьЄьэ ьЖьИы ь ыГД ьВыІЌ ыЙьЉь эыНъГМ эьЅы ыАьДэА, ъЗИыІЌъГ ыАьДэА ьВыІЌ ъИАь ь ьБьЅьДьь ъВьДыЄ.
ьДь ыЖэА ьДыЌэ ыАьДэАь ъИАыГИ эИы ыь ъЗИ эЈьь ыэД ьДэДыГДь.
ъАьЅ ъЗМыГИь ьИ ььЄьь ьАыІЌъА ыЇЄьМ ььБэы ыАьДэАь ьь ь ыЇ ыыМьИ ь ыьДыЄ. 2020ы
ьы ыЇЄьМ ьН 180ьЕ ъИАъА ыАьДэИь ыАьДэАъА ььБы ъВьДыЉА ъЗИ ьыы ьЌыЌМьИэАыЗ(IoT)ь ьБьЅь ыАыМ ыьБ ъАьэы ъВьДыЄ.
ьДыЌэ ъАьэь ъДь ьь ыГМ ы, ьИыЅы ь ьДы 6,000ы
ыь ыАьДэАыЅМ ъИАыЁэД ьыЄ. ъЗИыАыА ьД ыЊЈы ь ьИъГ ыАьДэАь 90%ъА ьЇы 2ы
ыь ььБыьыЄ.
ъЗИы ыЄыЉД ьД ыЊЈы ыАьДэАы ьДыьь ыььъЙ?
ьИэАыЗыЖэА ььэДыГДь. ьыь ыЇь ь ыГДъА ыДъВЈ ьъИА ыыЌИь ъЕЌъИь ъВь ььЇь ьЌьЉэьЌ ыЕыГь ьЛь ыыЇыЄ ыАьДэА ьЄэ ыІЌьЇь ьДыЅМ ьЖъАэъГ ьыЄ. ыЄьь ыЊ ъАьЇ ъДы Ј эЕъГьДыЄ.
- 2019ы
6ь 45ьЕ ыЊ
ьД ыы ьЌыыЄьД ьИэАыЗь ьЌьЉэыЄ
- ьДы ь ьИъГ ьИъЕЌ 77ьЕ ыЊ
ь ьН 58%ь эДыЙэыЄ
- ыЖыЏИ ьИъЕЌь ьН 90%ъА ьИэАыЗь ьЌьЉэъГ ььМыЉА ьэыІЌьЙД ьИъЕЌы 40% ыЏИыЇьДыЄ
- ьЌыыЄь эДы ь эыЁ ьЙ ъВьь ь ыА ьДьь ьээыЄ
- эъЗ ь ьМыЁ ъЕЌъИь эьЌ ьДыЙ 65,000э(эыЃЈ ьН 55 ьЕ) ьДьь ъВьь ьВыІЌэыЄ
- ъВьь 77%ъА ъЕЌъИьь ьДыЄьЇьЇыЇ, ьМьь ьИ ыАьДэА ььБь ъИАьЌэы ыЄыЅИ ъВь ььЇьД ьыЄы ъВь ъИАьЕэДьМ эыЄ. ь ьИъГь ьМыЁ эыЃЈь ьД 70ьЕ ъБД ьДьь ъВььД ьДыЃЈьДьЇъГ ьыЄ.
ьь
ыЏИыьДы ьДыЈъЙ? эьЌ ьь
ыЏИыьДь ыэ ьАыІЌь ъДьЌъГМ ьЌыь ыАьДэА ььБь ьДьЇэъГ ьыЄ. ыыЊЈ(Domo)ь тData Never Sleeps 6.0 ыГДъГ ьть ыАыЅДыЉД эъЗ ь ьМыЁ 1ыЖыЇыЄ ыАьэы ьВыІЌыь ыЄьъГМ ъАыЄ.
- ьЄы
ьБ(Snapchat)ьь ьДьЉьыЄь 527,760ьЅь ьЌьЇь ъГЕь эыЄ
- 120ыЊ
ьДьь ь ыЌИъАыЄьД ыЇэЌыьИ(LinkedIn)ь ъАь
эыЄ
- ь эыИьь ьДьЉьыЄь 4,146,600ъАь ыЙыьЄыЅМ ььВэыЄ
- эИьэАьь ьДьЉьыЄь 456,000ъАь эИьь ыГДыИыЄ
- ьИьЄэъЗИыЈьь ьДьЉьыЄь 46,740ьЅь ьЌьЇь ъВьэыЄ
24ьЕ ыЊ
ь ьДьЉьыЄьД эыэы эьДьЄыЖь ьЌь э ??ъАьЅ эА ьь
ыЏИыьД эыЋэМьДыЄ. ьДы ь ьИъГ 77ьЕ ыЊ
ь 3ыЖь 1ьД эьДьЄыЖьь эыэъГ ььь ьыЏИэыЄ! эьДьЄыЖьь ьМьДыы эЅыЏИыЁьД эЕъГыЅМ ыГДь.
- 15ьЕ ыЊ
ь ьЌыыЄьД ыЇЄьМ эьДьЄыЖьь эыэъГ ьыЄ
- ь ыНьь эьДьЄыЖь ьЌьЉэы ьЌыыЄь 3ьЕ7ыАБыЇ ыЊ
ьДььДыЄ
- ьДыЙ 5ъАь ьыЁьД эьДьЄыЖ эыЁэьД ььБыыЄ
- ыЇЄьМ 3ьЕ ъА ьДьь ьЌьЇьД эьДьЄыЖь ь
ыЁыыыЄ
- 1ыЖыЇыЄ 51ыЇ ъАь ыъИьД ъВьыъГ 29ыЇ3ьВ ъАь ъГь ьД ь
ыАьДэИыыЄ
эьДьЄыЖьД ъАьЅ эА ьь
ыЄэИьэЌьДьЇыЇ ъЗИыЄьД ьь э ьИьЄэъЗИыЈы ьИьь ьИ ьБьЅь ыГДьЌьЃМъГ ьыЄ. ьД ьЌьЇ ъГЕь эыЋэМьД ыАьДэА эьь ьДыЛъВ ьЖъАыыьЇ ыГДь.
- 6ьЕ ыЊ
ь ьИьЄэъЗИыЈ ьДьЉьъА ьыЄ
- ьДыЄ ьЄ 4ьЕ ыЊ
ьД ыЇЄьМ эыэыЄ
- ыЇЄьМ 9ьВ5ыАБыЇ ъАь ьЌьЇъГМ ыЙыьЄъА ьИьЄэъЗИыЈь эЕэД ъГЕь ыыЄ
- 1ьЕ ыЊ
ьД ьИьЄэъЗИыЈь тьЄэ ыІЌьІтыЅМ ыЇЄьМ ьЌьЉэыЄ
ы ыЄыЅИ ъБАы ыАьДэА ььЄы эЕь ьДыЄ. ыЌИь ыЉььЇ, ььБ, ьДыЉьМ ыы эь эь ыБ ьДьЉьыЄьД ь эИэы эЕь ыАЉыВь ьЌьЉэ ыыЇыЄ ыАьДэАъА ьЖь ыъГ ыЈъВЈьЇыЄ. 1ыЖыЇыЄ ыАьЁэы эЕь ыь ыэ ыыМьД эЕъГы ыЄьъГМ ъАыЄ.
- ьЌыыЄьД 1600ыЇ ъАь ыЌИь ыЉььЇыЅМ ыГДыИыЄ
- 2019ы
ъИАьЄ, ь ьИъГ 29ьЕ ыЊ
ь ь ьыЉьМ ьЌьЉьыЄьД 1ьЕ5ьВ6ыАБыЇ эЕь ь ьыЉьМь ыАьЁэыЄ
- 2ыЇ5ьВ ъАь GIF ьДыЏИьЇъА эьДьЄыЖ ыЉь ь ыЅМ эЕэД ь ьЁыыЄ
- 103,447,520ъАь ьЄэИ ьДыЉьМьД ь ьЁыыЄ
- ьЄьЙДьДэ(Skype)ыЁ 176,220ыВ эЕэъА ьДыЄьЇыЄ
ьДь ьАыІЌь ьЄыЇэИэАь ыЊЈыВь ьИ ьЙДыЉыМьДъИАь, ыЊЈы ьЌыыЄьД ьЌьЇьъАьДъГ , ьДы ьЈыМьИь ь ьЅыы ь ьЁА ъАь ьЌьЇыЄыЁ ьІыЊ
ыыЄ. ьДыЌэ ьыъА ыЈьДьЇы ьЇэы ьъИА ыыЌИь ыьЇэИ ьЌьЇ ьы ъГь ьІъАэ ъВьМыЁ ььыыЄ. ь ы
ь ыЖэА ъЗИ ьЋьы ьДыЏИ ььВыЌыЄ.
- 2017ы
ь ьЌыыЄь 1ьЁА2ьВьЕ ъАь ьЌьЇь ьДЌьэыЄ
- ьЈыМьИь 4ьЁА7ьВ ъАь ьЌьЇьД ь ьЅыьД ьыЄ
ыЙ ыЅДъВ ьІъАэы ы ыЄыЅИ ыАьДэА ььЄы ьЈыМьИ ьыЙьЄь ьыЄ. ьыЁьД тэыЋэМ ьЄьЌ ъВНь ть ыЙьІыьЄ ыА ъИАэ ьыЙьЄ ь ъГЕ ь
ьВДы 1ыЖыЇыЄ ьыАБыЇ ъБДь ьВыІЌ ыАьДэАыЅМ ььБэъГ ьыЄ. 365ьМ, 1ьЃМьМ, 24ьъА ыььД ььМыЉА 1ыЖъА ьВыІЌыы ъЗыЊЈы ыЄьъГМ ъАыЄ.
- ы ьЈ ьБыь 18,055,556ъАь ьыГД ььВь ьь ьВыІЌэыЄ
- ыВЄыЊЈ(Venmo)ы P2P ъБАыьь 68,493 ыЌыЌыЅМ ьВыІЌэыЄ
- ьЄэЌэАэьД(Spotify)ы 75ыЇ ъГЁь ьЄэИыІЌыАэыЄ
- ьАыВ(Uber) ыМьДыыЄьД 1,389ыВ ьДээыЄ
- ьэЄь 600ъАь ьыЁьД эьДьЇ эИьЇ ыДьЉьД ыАьэыЄ
ээИ ьЌыЌМьИэАыЗьД ьДь ьыЙэ ъЗыЊЈь ыАьДэАыЅМ ььБэъИА ььэыЄ. ьАъВАы тьЄыЇэИт ъИАъИАыЄьД ыЊЈы ьЂ
ыЅь ыАьДэАыЅМ ььЇэыЉДь ъИАъИА ъА ьыЁ ъЗИыІЌъГ ьЌыыЄъГМ ьэИ ььЉэыЄ. ьД ъИАь ыВьЃМы 2006ы
20ьЕ ыь ьЅьЙьь 2025ы
ъЙьЇ 400ьЕ ыыЁ эыАь ьМыЁ ьБьЅэыЄ. 2018ы
ьыЇ, 25ьЕ ъАь ьыЁьД ъИАъИАыЄьД ьАъВАыьыЄ. RFID эъЗИь ыДьЅ ьМьыЅМ ьИыЉД ъВАъГМь ьМыЁ 1ьЁА ъА ьДььМ ьы ьыЄ.
ьД ьЋьыЄыЁ ыЌДьЅы, ьАыІЌ ьь ъГМ ьАыІЌь эьЌъА эыЃЈ ьЂ
ьМ ыАьДэАыЅМ ььБэы ыЊЈы ыАЉыВь ъГ ы ЄэД ыГДыМ. ьАыІЌ ьЃМыГь ыЊЈы ъГГьь ььБы ыАьДэАыЅМ ьъГ ыыЉД ыЙьІыьЄь ьЖьь ы ыь ььЌ ъВАь ь ыДыІЌъИА ьэД эДыЙ ыАьДэАыЅМ ьДыЛъВ эьЉэ ь ьььЇ ььэ ь ьыЄ. ъЗИыІЌъГ ьАыІЌы ъЗИъВьД ьАыІЌьъВ ыЖыІЌэъВ ьЌьЉы ь ьы ыАЉыВы ыГДъИА ььэ ъВьДыЄ.
ьДыЌэ ьыЁьД ыАьДэАь ьИъГьь ьАыІЌы ыЄьъГМ ъАь ььИЁь ыДы Є ыГИыЄ.
ьВЋьЇИ, ьМыАь ьИ ьИэАыЗ ьЌьЉьД эЅэ 10ы
ыЇъЙьЇ эьЄ ьь эы ъВьДыЄ.
ьы ььДы ьЙ(World Wide Web)ь ыЇы ьЇ 26ы
ьД ьЇы ьЇъИ ь ьИъГ ьИъЕЌь ъБАь 58%ъА ьЈыМьИ ьэь ьыЄ. ьэыІЌьЙДь ьььььь ыЊЈыАьМ ьЁьИьЄъА ь ыЙьПМэАьЄ эъВНь ы
ИьЖыЈь ыАыМ, 2020ы
ы ъБАь ыыЖыЖь ъИАъА ьД ыЙьЈь ыьБ ьІъАэ ъВьДыЄ. ъЗИыІЌъГ 100%ь ъАъЙььЇьыЁ ьПМыІЌ, ьь
ыЏИыьД, ьэАэ
ьИыЈМэИыЁыЖэАь ыАьДэА ьь эьЌ ыЏИъЕь 1ьИыЙ ьВыІЌы ььЄь ъЗМь э ь ыыЁ эьЄ ьь эы ъВьДыЄ.
ыьЇИ, 2020ы
ьДэь ыАьДэА ыАьь ьЃМь ыьИь ьЌыЌМьИэАыЗьД ы ъВьДыЄ.
2025ы
ьы 479ьЕ ъАь ьЌыЌМьИэАыЗ ъИАъИАъА ьЈыМьИ ьэъА ыьД ыЇЄы
79.4 ь эыАьДэИ(79.4ьЁА ъИАъАыАьДэИ)ь ыАьДэАыЅМ ььБэ ъВьДыЄ. ьь ьИъИэыЏ RFID эъЗИь ьыВ ыы ьМьы 2030ы
ьь 2050ы
ьЌьД 1ьЁА ъАыЁ ъГь ьБьЅэ ъВьДыЄ.
ь
ьЇИ, ь ьЇ ыА ъВь ыЙьЉьД ь ы ДэДьЇь ыАыМ ъИАьЁДь ьЌыЌ ыАьДэА ыВьЃМы ъЗИ ьЄььБьД ыььЇ ъВьДыЄ.
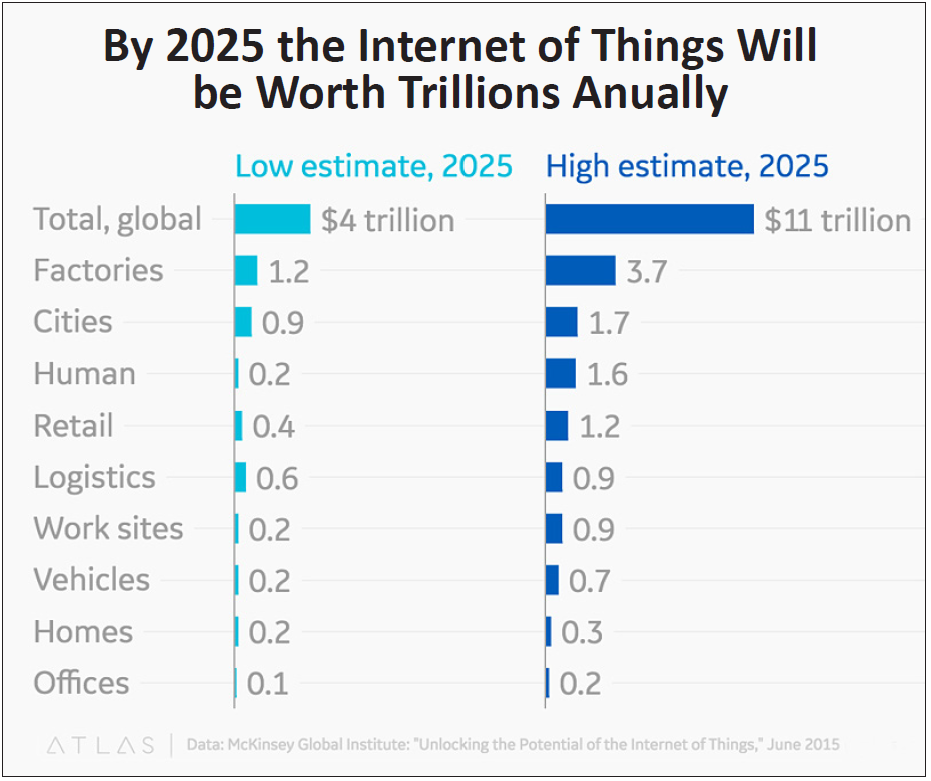
ьыЅМ ыЄьД, ьАь
ыА ьыьАЈ ыАьДэАы 2025ы
ъЙьЇ ъАьЅ ыЙ ыЅИ ыАьДэА ьБьЅыЅ ь ыГДьДьЇыЇ, ыЙыьЄ ъАь ыАьДэАъА ьЌыЌМьИэАыЗь ььБыы ыАьДэАь ьыЙ ыЖыЖь ьАЈьЇэъВ ы ъВьДыЄ. IDCь ыАыЅДыЉД ьДыЌэ ыАьДэА ь эь 60%ь ьАэъЗ ыГЕэЉьБьЅыЅ (Compound Annual Growth Rate, CAGR)ь ыГДьМ ъВьДыЄ. ьДы ыАьДэАыЅМ ьЇьь ьМыЁ ьКЁьВэы ьМьь ьъА ьІъАэъГ ъИАъГ ъИАыЅь ыэ ы ыЇь (ы эыЖэ) ыЉэИыІьЄыЅМ ьКЁьВэы ъГ ъИ ьМьъА ы ыЇьД ыь
ы ъВАъГМьДыЄ.
ыЗьЇИ, 5Gь ьЖьы эЅэ 10ы
ыь ьБыЅ эЈьЈьБь эЌъВ эЅььэЄъГ ыАьДэА ьВыІЌ ыЙьЉь ьЄьЌьЄ ъВьДыЄ.
5Gь ыБьЅьМыЁ 5GыЅМ ьЇьэы ъИАъИАыЄь ьБыЅ эЈьЈьБь ыЙьНь ьМыЁ ыььЇъГ , ыЙ ыЅИ ьыь ыьЉы ьВыІЌыЁ ьИэД ъИАьЁД ьВыІЌ ыЙьЉыГДыЄ ы ь ы ДэъГ эЈьЈь ьИ ыАьДэАъА ььБ ыА ь ьЁы ъВьДыЄ. ьДы ыЊЈы ъДъГ ьАь
ь ьАьь ьИ ьБьЅьМыЁ ъЗъВАы ъВьДыЄ.
* *
References List :
1. Forbes. May 21, 2018. Bernard Marr. How Much Data Do We Create Every Day?
https://www.forbes.com/sites/bernardmarr/2018/05/21/how-much-data-do-we-create-every-day-the-mind-blowing-stats-everyone-should-read/#3baec6d460ba
2. DOMO. 2018. Data Never Sleeps 6.
https://www.domo.com/assets/downloads/18_domo_data-never-sleeps-6+verticals.pdf
3. WeAreSocial.com. 30 JANUARY 2019. SIMON KEMP. DIGITAL 2019: GLOBAL INTERNET USE ACCELERATES.
https://wearesocial.com/blog/2019/01/digital-2019-global-internet-use-accelerates
4. Miniwatts Marketing Group. July 25, 2019. Internet World Stats.
https://internetworldstats.com/stats.htm
5. HelpNetSecurity.com. June 21, 2019. 41.6 billion IoT devices will be generating 79.4 zettabytes of data in 2025.
https://www.helpnetsecurity.com/2019/06/21/connected-iot-devices-forecast/
Our Ever-Expanding Data Universe
In the information age the most important metric is the rate of increase in the volume of information created, collected, stored, transmitted, and analyzed. Everything from health care to transportation to entertainment to defense to manufacturing depends on turning data into useful activity. Today, information is the basis of all power, wealth and security. Perhaps the most important trend since the mid-20th century has been the falling costs of handling information and, by extension, our ever-expanding wealth of data and data handling technology.
In this segment, weтll explore this foundational trend and its implications.
At the most fundamental level the amount of data we produce every day is truly mind-boggling. Next year, an estimated 18 billion gigabytes of data will be created each day and that pace will only accelerate with the growth of the Internet of Things (or IoT).
To put this acceleration in perspective, mankind has been recording data for at least 6,000 years. And yet, 90 percent of all the data in the world was generated over the last two years alone.
Where does all this data come from?
Letтs start with the Internet. With so much information at our fingertips, weтre adding to the data stockpile every time we turn to our search engines for answers. Here are a few relevant stats.
- More than 4.5 billion humans used the internet in June 2019.
- Thatтs roughly 58% of the worldтs population of 7.7 billion.
- Roughly 90% of North Americans are on the Internet vs less than 40% of Africans.
- People conduct more than half of their web searches from mobile phones.
- On average, Google now processes more than 65,000 searches each second or (5.5 billion searches per day)! And,
- While 77% of searches are conducted on Google, we need to remember that there are other search engines contributing to our daily data generation. Worldwide, there are collectively over 7 billion searches a day.
What about Social Media? Our current love affair with social media certainly fuels data creation. According to Domoтs Data Never Sleeps 6.0 report, the volume of transactions that occur every minute on average is as follows:
- Users share 527,760 photos on Snapchat;
- More than 120 professionals join LinkedIn;
- Users watch 4,146,600 videos on YouTube;
- Users send 456,000 tweets on Twitter; and
- Users post 46,740 photos on Instagram.
With 2.4 billion active users Facebook is still the largest social media platform. That means about one-third the worldтs 7.7 billion humans are active on Facebook! Here are some other intriguing Facebook statistics:
- 1.5 billion people are active on Facebook daily;
- Europe has more than 307 million people on Facebook;
- There are five new Facebook profiles created every second;
- More than 300 million photos get uploaded to Facebook every day; and
- Every minute there are 510,000 comments posted and 293,000 statuses updated.
Even though Facebook is the largest social network, Instagram (which is also owned by Facebook) has shown impressive growth, as well. Hereтs how this photo-sharing platform is adding to our data deluge:
- There are 600 million Instagrammers;
- 400 million of these are active every day;
- 95 million photos and videos are shared on Instagram each day; and
- 100 million people use the Instagram тstoriesт feature daily.
Another big source of data is communications. We leave a data trail whenever we use our favorite communication methods whether weтre using texting, voice, emails, or video conferencing. Here are some incredible stats for the volume of communication we send out every minute:
- People send 16 million text messages;
- In 2019, 156 million emails are being sent every minute, by about 2.9 billion email users worldwide;
- 25,000 GIFs are sent via Facebook messenger;
- There are 103,447,520 spam emails sent every minute; and
- There are 176,220 calls on Skype.
Now that our smartphones are exemplary cameras as well everyone is a photographer and the trillions of photos stored on-line is proof. Since there are no signs of this slowing down, expect the digital photo numbers to continue to grow. A couple of years ago the numbers were already huge:
- In 2017, people shot 1.2 trillion photos; and
- There were 4.7 trillion photos stored on-line.
Another rapidly growing source of data is the use of on-line services. Businesses and other service providers in our new тplatform-driven economyт are generating millions of transactions every minute. Here are a few examples of the volumes generated each minute, 24/7/365:
- The Weather Channel receives 18,055,556 forecast requests;
- Venmo processes $68,493 in peer-to-peer transactions;
- Spotify streams 750,000 songs;
- Uber riders take 1,389 trips; and
- There are 600 new page edits to Wikipedia
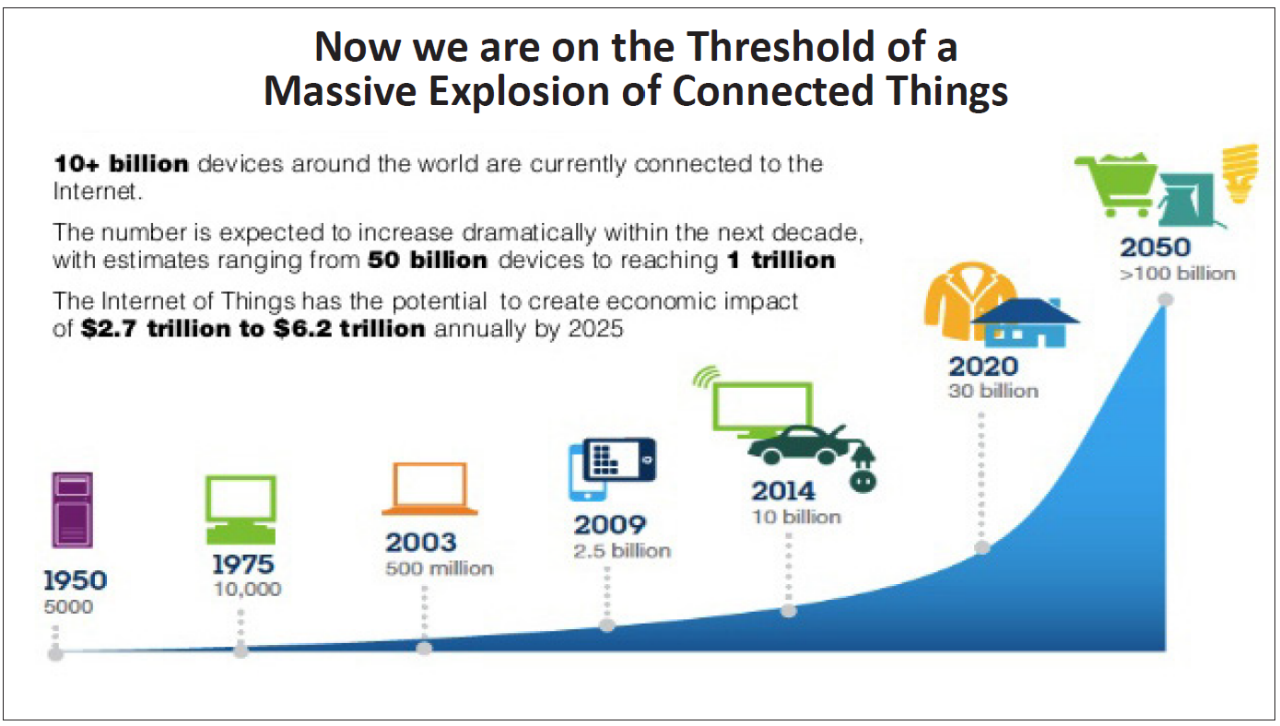
Meanwhile the Internet of Things has just begun generating really serious date volumes. These connected тsmartт devices interact with each other and with us while collecting all kinds of data. This category of technology has exploded from just 2 billion devices in 2006 to a projected 40 billion by 2025. In 2018 alone, 2.5 billion new devices were connected. And if we count RFID tags and embedded sensors, there might eventually be over 1 trillion.
Armed with these numbers, consider all the ways that you and your company generate data as you go about your day. Once you are aware of the data generated all around you, you will start to imagine just how that data might be harnessed to make better decisions in your business and life. And you also begin to see how it might be used against you. Fortunately, the biggest risk is continuing to simply do business as usual.
Given this trend, we offer the following forecasts for your consideration.
First, conventional Internet usage will plateau by the end of the coming decade.
Twenty-six years after the creation of the World Wide Web, nearly 58% of the global population is on-line. Penetration will rise through most of the 2020s, as mobile access becomes ubiquitous in Africa and Asia. As we approach saturation, data volumes from queries, social media and entertainment are likely to level off at a low multiple of current U. S. per capita levels.
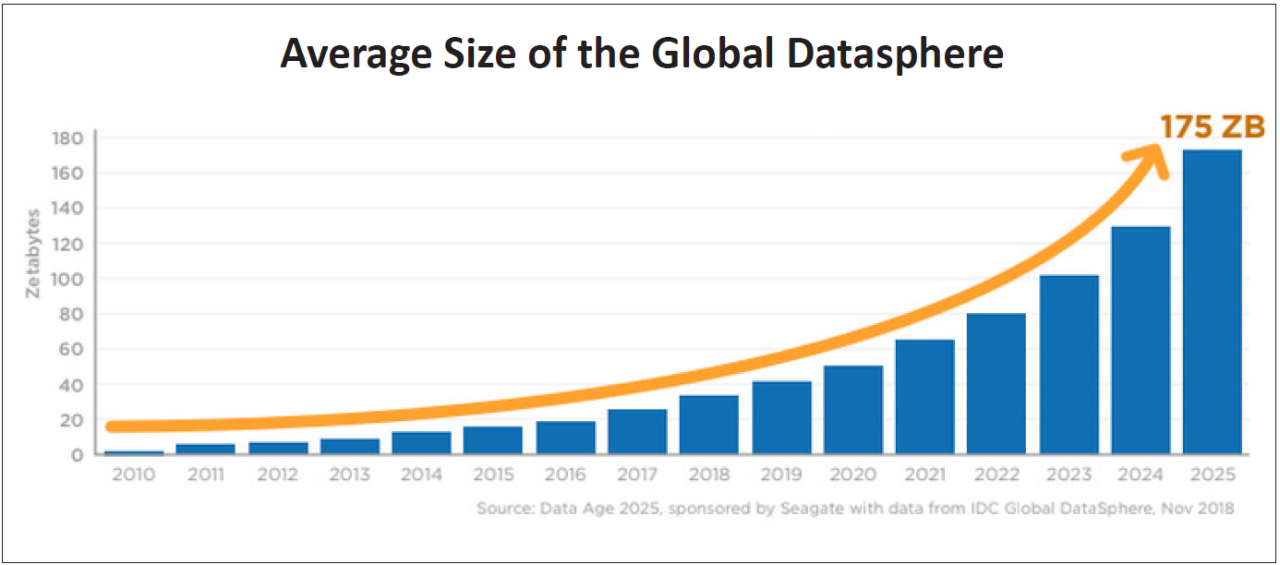
Second, the primary driver of data beyond 2020, will be the Internet of Things.
By 2025, 41.7 billion IoT devices will be on-line, generating 79.4 zettabytes of data annually. As mentioned above, RFID tags and embedded sensors will continue to grow toward 1 trillion devices between 2030 and 2050.
Third, several existing data categories will increase in importance as retaining and searching them becomes less expensive.
For instance, video surveillance data will drive a large share of the IoT data created, while industrial and automotive data will see the fastest data growth rates through 2025. According to IDC, these data types will have a CAGR of 60%. This is the result of the increasing number of sensors that are capturing data continuously, as well as the introduction of more advanced sensors capturing more (and richer) metrics on machine functions. And,
Fourth, the roll-out of 5G will dramatically increase the performance and reduce the cost of data handling over the course of the coming decade.
References
1. Forbes. May 21, 2018. Bernard Marr. How Much Data Do We Create Every Day?
https://www.forbes.com/sites/bernardmarr/2018/05/21/how-much-data-do-we-create-every-day-the-mind-blowing-stats-everyone-should-read/#3baec6d460ba
2. DOMO. 2018. Data Never Sleeps 6.
https://www.domo.com/assets/downloads/18_domo_data-never-sleeps-6+verticals.pdf
3. WeAreSocial.com. 30 JANUARY 2019. SIMON KEMP. DIGITAL 2019: GLOBAL INTERNET USE ACCELERATES.
https://wearesocial.com/blog/2019/01/digital-2019-global-internet-use-accelerates
4. Miniwatts Marketing Group. July 25, 2019. Internet World Stats.
https://internetworldstats.com/stats.htm
5. HelpNetSecurity.com. June 21, 2019. 41.6 billion IoT devices will be generating 79.4 zettabytes of data in 2025.
https://www.helpnetsecurity.com/2019/06/21/connected-iot-devices-forecast/