과소평가와 오해를 받고 있는 미국 경제의 저력
By Global Trends Editor Group
최근의 혼란에도 불구하고 미국은 여전히 세계에서 가장 부유하고 역동적인 경제 대국이다.
선택에 따라, 미국은 여전히 국민들에게 전 세계 최고의 삶의 질을 제공할 수 있다.
그렇다면 우려의 시선을 받고 있는 현재 미국의 부채 위기, 경제성장, 소득과 부의 불평등의 문제를 어떻게 해석해야 할까?
오해를 받고 있는 미국 경제의 저력을 해부해보자.
텔레비전이나 월드와이드웹(World Wide Web)을 통해, 소위 전문가들과 정치인들이 미국 경제에 대해 다음과 같은 6가지 도발적 주장을 펼치고 있다.
“미국의 경제성장이 용납할 수 없는 수준으로 둔화되었다.”
“소득 불평등이 놀라운 속도로 계속 고조되고 있다.”
“부채 수준이 관리하기 어려울 지경에 이르렀다.”
“생산성과 노동자 임금 간 연결이 끊어졌다.”
“노동자 임금은 수십 년 동안 정체되었다.”
“계층 상승은 이제 과거의 일이 되었다.”
단도직입적으로 말하자면 이러한 주장은 일부의 사실에 기반하고 있다.
물론 이러한 문제들을 해결하지 않고 방치할 경우 향후 수 년 내 미국의 핵심 경쟁 우위가 약화될 수는 있다.
다만 이러한 주장들과 실제 현실 사이에는 간격이 있다.
왜 이러한 주장이 발생했고, 왜 미국 경제에 대한 신뢰 저하로 이어지고 있는지 한 번 살펴보자.
먼저 “미국의 경제성장이 용납할 수 없는 수준으로 둔화되었다”는 주장을 보면, 이 인식은 부분적으로 정확하다.
금융 위기가 시작된 후 미국의 실질 GDP 성장은 장기적으로 연간 3.1%에서 2.1%로 둔화되었다.
이는 역사적으로는 부진한 성적이다. 하지만 미국 경제는 지난 15년 동안 82%나 성장했다.
통상적으로 성장을 언급할 때 등장하는 용어는 생산량이다. 생산량은 ‘노동시간’과 ‘시간당 생산성’으로 결정된다.
성장은 두 가지 중 하나 또는 모두 증가할 때 발생한다.
여기에서 ‘노동시간’은 각 노동자들이 근무한 시간과 노동자 수로 계상된다.
‘시간당 생산성’은 일반적으로 기업이 더 많은 자본 장비, 더 높은 수준의 역량 또는 우수한 기술을 추가할 때 증가한다.
그렇다면 미국은 현재 어떠할까?
경제 성장에 영향을 미치는 첫 번째 요인을 보자. 바로 인구 증가 둔화와 낮은 노동 참여율이다.
미국에서 인구 증가 둔화는 이민 장벽과 낮은 출산율로 인해 발생했다. 하지만 노동 참여에 부정적 영향을 끼칠 수 있는 ‘사회 안전망’으로 인해 상황은 더욱 악화되었다.
두 번째이자 더 심각한 문제는 얼어붙은 생산성 증대에 있다.
자본 투자와 기술 발전은 일반적으로 근무 시간당 생산량을 높여 준다. 그러나 닷컴 붐 시기를 제외하고 1973년 이후 이 속도가 눈에 띄게 둔화되었다.
왜 이런 일이 일어났을까? 경제 발전이란 주로 기술 발전에 의해 결정되기 때문이다.
제2차 세계대전부터 1973년 사이에 일어난 일을 보자. 당시 우리는 엄청난 생산성 증대를 목도했는데, 이 시대는 대량 생산으로 대변되는 성장의 황금기였다.
이러한 생산성의 놀라운 증대는 전후 시장 기회와 전쟁 중 이루어진 자본 투자 및 신기술의 상업화에 의해 가능해졌다.
여기에 주간(Interstate) 고속도로, 항공, TV 방송, 할인 소매점, 대규모 조립 라인이 결합되어 활기찬 생태계를 지원했다.
하지만 크게 염려할 필요는 없다. 현재 이러한 류의 황금기가 디지털 기술의 발달로 재등장하고 있기 때문이다.
이 새로운 황금기는 2030년대 중반까지 지속될 것으로 예상된다. 변화 중 대부분은 자연스럽게 발생할 것이다.
또 다른 변화들은 정부의 장려로도 발생할 것이다. 따라서 친성장 정책이 무척 중요하다.
경제 성장 둔화의 세 번째 이유는 지난 15년 동안 미국 경제를 지배한 상품과 서비스의 종류를 정량화하기 어렵다는 데 있다.
그 가치의 대부분이 질적이고 주관적이기 때문이다.
예를 들어, 스마트폰은 유선 전화, GPS 장치, 텔레비전, 축음기, 계산기, 개인용 컴퓨터, 책, 신문, 잡지 및 기타 수많은 장치를 대체하여 우리 삶의 질을 헤아릴 수 없을 정도로 향상시켰다.
또한 소셜 미디어 및 전자상거래 플랫폼과 같은 완전히 새로운 가치 자산을 활성화했다.
그러나 이러한 신제품은 대체 제품과 동일한 방식으로 GDP에 추가되지는 않는다.
밀레니얼 이후의 혁신이 이전의 물리적 제품이나 유료 서비스를 ‘무료’인 것처럼 보이는 광고 지원 디지털 서비스로 변화시켰기 때문이다. 그리고 이는 종종 GDP에 반영되지 않는다.
하지만 이제 미국은 ‘질적 무형자산’의 성장에서 벗어나 좀 더 ‘정량화 가능한 가치’로 돌아가는 전환의 문턱에 있는 것으로 보인다.
인공지능이 지원하는 신약, 재료, 기계, 프로세스 및 서비스가 실제로 GDP에 나타나는 새로운 생산 수익뿐만 아니라 연계 및 유관 수익을 창출할 것이기 때문이다.
다음은 “소득 불평등이 놀라운 속도로 계속 고조되고 있다”는 주장을 살펴보자.
미 의회 예산처는 고소득 가구와 저소득 가구 간의 소득 격차를 추정하기 위해 지니계수를 사용한다.
이러한 계산에는 일반적으로 두 가지 측정 방법이 사용되는데, 재미있는 것은 불평등 추세에 대해 서로 다른 답을 제공한다는 점이다.
측정 방법 중 하나는 소위 세전 소득을 기준으로 한 ‘시장 소득’이고, 다른 하나는 ‘세후 및 양도 소득’이다.
불평등을 측정하는 데 있어 세후 소득과 양도 소득은 의미가 있는 유일한 지표이다.
시장 소득과 달리, 세후 소득과 양도 소득은 생활수준에 대한 종합적인 측정치이기 때문이다.
즉, 국민의 실제 경제적 후생에 미치는 세금과 사회적 안정망의 영향력을 고려한 것이다.
세후 소득과 양도 소득 기준을 기반으로, 불평등은 1990년부터 2019년까지 30년 동안 7% 증가했다. 그러나 전체 증가는 1990년부터 2007년에 집중적으로 나타났다.
반면, 이러한 불평등이 2007년 이후에는 5% 감소한 것으로 나타났다.
불평등은 금융 위기와 월스트리트 점령 시위로 최고조에 달했지만, 정리하자면 미국의 소득 불평등은 실제로 지난 16년 동안 줄어들었다.
다음은 “부채 수준이 관리하기 어려울 지경에 이르렀다”를 살펴보자.
주장의 핵심은 이것이 앞으로 수년 내에 치명적인 문제를 야기할 것이라는 점이다.
이것이 사실일까? 먼저 미국의 가계 대차대조표 상태를 살펴보면, 현재 민간 부문 순자산은 154조 3천억 달러로 10년 전의 거의 두 배에 달한다.
인플레이션 조정 이후 미국 가구의 순자산은 1952년 이후 매년 평균 3.6% 증가해 왔고, 이는 70년 만에 12배 증가한 수치이다.
같은 기간 인구도 많이 늘었다는 평이 있지만, 인플레이션 조정 이후 1인당 데이터를 살펴보면 평균 미국인의 생활수준이 지난 73년 동안 거의 6배나 높아졌다는 것을 알 수 있다.
GDP 대비 연방 부채가 대략 124%라는 것은 생각해볼 여지가 있는 수치이다.
전후 거대한 붐이 시작되려던 2차 세계대전 말, 이 수치가 119%까지 치솟았다는 점에 주목하자.
이후 1970년대 중반에는 약 32%로 최저 수준으로 떨어졌고 2001년에는 55%를 조금 넘는 수준으로 상승했다.
현재의 수치는 금융 위기 및 코로나19 대유행과 관련된 부양책의 여파로 발생한 것이다.
124%는 높다고 볼 수 있지만, 연방준비은행이 금리를 통해 정부의 부채 상환 부담을 조정하고 있다.
또한 미국 이외의 법인에 대한 부채는 전체의 23%에 불과하며, 더 중요한 것은 부채가 미국 달러로만 표시되기 때문에 연방 정부는 대부분의 다른 국가가 국가 부채와 관련하여 직면하는 디폴트 위험에 직면하지 않는다는 점이다.
그리고 우리가 주목해야 할 것은 미국의 경제적, 지정학적 이점이 앞으로도 계속 긍정적이라는 데 있다.
이는 향후 수십 년 동안 미국의 GDP가 정부 부채보다 빠르게 증가하여 이 비율을 낮출 가능성이 크다는 의미이다.
물론, 정부 부문이 아닌 민간 부문의 어느 시점에서 파산이나 채무 불이행 가능성이 제로는 아닐 것이다.
다만 2007년 이후 민간 부문의 부채가 약 40% 감소했고, GDP 대비 민간 부문 부채 비율이 이제 1970년대 초 수준으로 되돌아갔다.
종합적으로 분석했을 때, 미국의 부채 수준은 우려할 상황은 아니다. 다만 미국 정부는 비생산적인 우선순위에 자금을 조달하기 위한 차입을 앞으로도 지양해야 할 것이다.
다음으로 “생산성과 노동자 임금 간 연결이 끊어졌다”는 주장을 살펴보자.
이에 대한 답은 ‘그렇지 않다!’이다. 미국기업연구소(American Enterprise Institute) 경제학자 마이클 R. 스트레인(Michael R. Strain)은 오히려 ‘생산성과 노동자 임금 사이의 연관성이 강력하다’는 주장을 펼친다.
그는 생산성 증가와 노동자 임금 증가가 10년 단위로 함께 움직인다는 것을 분석했고, 2000년 이후 약간의 차이만 있을 뿐, 단절의 증거는 없다고 말한다.
스트레인은 생산량을 총 생산량이 아닌 순 생산량으로 정의한다.
작업 시간당 순 생산량을 기준으로 계상된 생산성은 자본 감가상각을 제거하므로 의미가 있다.
‘감가상각비’는 소득의 원천이 아니기 때문에 노동자 보상과 생산성 사이의 연관성을 조사할 때 순 생산량이 더 나은 척도이다.
또 하나 고려해야 할 것은 비임금의 비중이다.
전체적인 노동자 보상에서 비임금이 차지하는 비중이 높아졌다는 것이 사실이다.
따라서 단순한 임금보상보다는 건강보험 등 비임금 보상을 이러한 구조에 포함시키는 것이 바람직하다.
이러한 분석 결과는 미국에서 생산성과 임금 사이의 연관성은 여전히 강력하다는 것을 분명히 보여준다.
결과적으로, 미국의 노동자들이 시스템에 대한 기여도에 비해 부족한 대우를 받고 있다고 주장할 이유는 거의 없다고 할 수 있다.
“노동자 임금은 수십 년 동안 정체되었다”는 주장은 어떨까?
이 주장의 가장 일반적 버전은 “1970년대 이후 실질임금이 전혀 오르지 않았으며, 이를 감안하면 지난 50년 동안 임금이 단지 5%만 올랐다”는 것이다.
이러한 주장은 장기적이고 광범위한 임금 침체 혹은 정체라는 개념으로 이동한다.
그러나 실제로 그럴까?
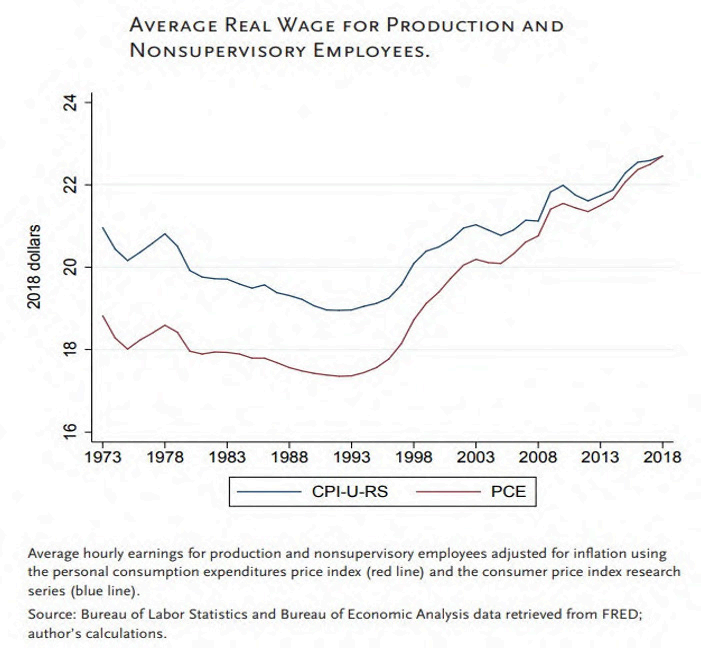
1990년 경기 주기 정점부터 2019년까지 실질임금은 소비자물가지수 대비 20%, 물가소비지출(PCE) 대비 33% 이상 상승했다.
스트레인이 강조하는 지표를 계상했을 때는 이렇게 다른 지수가 등장한다.
더욱이, 세후 수익과 양도 수익을 기준으로 사람들이 얼마나 많은 돈을 가지고 있는지 고려한다면 침체를 주장하기는 어렵다.
미 의회 예산처가 1979년부터 2019년까지 소득을 최근 조사한 결과 다음과 같은 5가지 사실이 확인되었다.
첫째, 2019년 기준 모든 소득 그룹은 평균적으로 가장 높은 세후 소득과 양도 소득을 기록했다.
둘째, 세후 소득과 양도 소득 증가가 상위 가구에서 가장 빠르게 발생했지만, 누진세와 사회 안전망 강화로 인해 전 가구의 증가 수준은 평균을 이뤘다.
셋째, 세후 소득과 양도 소득에 대한 최하위 5분위 소득은 전체적으로 94% 증가, 연간 1.7%씩 증가했다.
넷째, 세후 소득과 양도 소득에 대한 중위 3분위 소득은 전체적으로 59% 증가, 연간 1.2%씩 증가했다.
다섯째, 세후 소득과 양도 소득에 대한 최고 5분위 소득은 123% 증가, 연간 2.0%씩 증가하여 1979년 113,100달러에서 2019년에는 252,100달러에 이르렀다.
최고 소득 가구의 소득 증가가 약간 더 빠른 이유는 평균 연방 세율이 감소하였기 때문이다.
전체적으로, 미국에서 전 가구의 소득은 우상향 이동하고 있다.
계층 간의 소득 분포만 고려해도 이것은 사실인데, 40대 미국인의 약 73%가 부모 세대보다 실질 소득이 더 높은 것으로 나타났다.
결론은 무엇인가? 미국 경제가 과소평가되고 오해를 받고 있다는 것이다.
또한 미래에 대한 우려와 달리, 실질적 미국 경제를 보면 미래가 부정적일 이유가 없다는 것이다.
이러한 추세를 고려하여 우리는 다음과 같은 예측을 내린다.
첫째, 향후 10년 동안 실질적인 미국의 경제성장률은 금융위기 이전인 3.1% 추세로 되돌아갈 것이다.
이러한 성장의 배경에는 세계 최고 수준의 압도적인 인공지능 기술과 발전, 이를 통한 생산성의 퀀텀 점프, 다양한 응용과 적용, 세계 최고의 인재 보유가 있다.
둘째, 미국의 경제 성장과 부활의 가장 큰 위협은 외부가 아닌 내부, 즉 지속적인 과잉 규제와 관련이 있을 것이다.
예전 기준에 의해 탄생했지만 현재 기준에는 맞지 않는, 비생산적인 규정들, 그리고 이 규정을 준수하는 데 드는 예산과 자원 낭비가 우선 재편되어야 할 것이다.
미국 경제에 지난 40년 동안 누적된 잘못된 규정들이 빠르게 제거되어야만 GDP 성장률을 연간 최소 1%씩 더 영구적으로 높일 수 있다.
셋째, 2020년대 미국의 성장은 전 세계적인 인구통계학적 위기로 인해 더욱 더 큰 이익을 발생시킬 것이다.
중국으로 대변되는 새로운 냉전은 자원과 기술의 전 세계적 흐름을 점점 더 제한할 것이다. 이로 인한 실질적 피해는 중국과 러시아의 경제 동맹이다.
인구통계학적 현실도 미국에게 유리하다. 현대 대부분의 유럽과 아시아 국가들의 인력은 급속히 노령화, 축소화되어 경제 성장 가능성을 제한하고 있다.
이 두 가지 이유로 미국의 리쇼어링과 동맹국들의 쇼어링이 가속화되면서, 가장 우수하고 뛰어난 인력들이 가장 크게 성장할 수 있는 곳으로 이동하게 될 것이다.
여러 지역이 물망에 오를 수 있지만 현재로서는 미국이 그중 가장 매력적인 곳임은 분명하다.
넷째, 개인의 특정 기술력과 역량에 프리미엄이 크게 부과되면서, 절대적인 소득 불평등이 소폭 증가할 가능성이 높다.
이러한 증가는 숙련된 블루칼라 노동력이 부족한 곳에서 더욱 크게 부각될 것이다.
다섯째, 인공지능을 통한 생산성 증대가 시작되면서 GDP 대비 국가 부채 비율은 줄어들 것이다.
GDP의 빠른 성장은 세입을 증가시켜 부채 비율을 떨어뜨릴 것이다.
1990년대와 마찬가지로, 기술 중심의 경제 붐은 더 많은 흑자를 창출한다.
낮은 이자율과 결합하여 이러한 요소들이 국가 부채 비율을 낮추게 될 것이다.
여섯째, 대부분의 산업에서 이윤폭이 확대되면서, 전체 노동자 보상이 계속해서 생산성과 보조를 맞출 것이다.
또한 이익에 대한 기술의 기여도가 높아짐에 따라 주주 수익도 가속화될 것이다.
이러한 이익은 노동자 희생을 기반으로 발생하지는 않을 것이다.
Resource List
1. Faster, Please! September 4, 2023. JAMES PETHOKOUKIS. What is the outlook for long-term US economic growth?
2. Seeking Alpha. August 30, 2023. Scott Grannis. Is This A Great Country Or What?
3. Seeking Alpha. August 30, 2023. Scott Grannis. 2% Growth And 2% Inflation: The Fed’s Done.
4. Faster, Please! August 21, 2023. JAMES PETHOKOUKIS. Four shocking truths about the American economy! (Well, shocking to some.)
5. Trends. October 11, 2014. Trends Editors. America’s Slow, Painful Techno-Economic Transition.
America’s Mis-underestimated Economic Reality
By Global Trends Editor Group
Unless you’ve turned off your access to television or the World Wide Web, you’ve certainly heard pundits and politicians making the following six provocative assertions about the U.S. economy:
1. Economic growth has slowed to unacceptable levels;
2. Income inequality continues to rise at an alarming rate;
3. Debt levels are unmanageable;
4. The link between productivity and worker pay is broken;
5. Worker wages have gone nowhere for decades; and
6. Upward mobility is a thing of the past.
In reality, each of these assertions is demonstrably false!
However, there are related trends which, if left unaddressed, could diminish some of America’s core competitive advantages in the years ahead.
Given the growing gap between perception and reality, let’s examine these beliefs and why they are so prevalent.
Let’s start with the assertion that, “Economic growth has slowed to unacceptable levels.”
In this case the perception is partially correct.
Since the beginning of the Great Financial Crisis, the growth trend-line for real U.S GDP has slowed from a long-term rate of 3.1% a year to just 2.1% a year.
And while this is historically lackluster, it has enabled the U.S. economy to grow 82% over the past 15 years, while Europe has grown just 6%!
America’s downshift in growth was caused by three factors which are easy to understand.
Output is defined by “hours worked” times “productivity per hour.”
Growth arises when either or both of those numbers grows.
“Hours worked” is constrained by the number of hours worked by each worker and the number of workers.
Productivity-per-hour typically grows when businesses add more capital equipment, higher levels of skill, or superior technologies.
The first factor impacting U.S. economic growth is slowing population growth coupled with lower labor force participation rates.
This slowdown in population growth is caused by immigration barriers combined with low birth rates.
However, it’s exacerbated by a social safety net which fails to demand workforce participation.
If we examine real GDP per capita, we see that going all the way back to the Civil War, real per capita growth has varied only modestly from an average of 2% a year, compounded.
That confirms that demography places real limits on what is possible.
A second and more serious problem is glacial productivity growth.
Capital investments and increased skills typically raise output per hour worked.
However, the rate slowed markedly after 1973, except during the Dot-Com boom.
Why? Because economic progress is determined largely by technological progress.
As we’ve explained in prior issues, the enormous surge in productivity we saw between World War II and 1973 represented the “golden age” of the Mass Production Era.
That extraordinary surge in productivity was enabled by post-war market opportunities coupled with commercialization of the capital investments and discoveries made during the war.
Interstate highways, airlines, broadcast TV, discount retailers, and large-scale assembly lines combined to support a vibrant ecosystem.
As highlighted in trend #2 this month, digital technology is now in a similar golden age which is forecasted to run through the mid-2030s.
Many of these changes will happen naturally, but others will need to be encouraged.
Important pro-growth policy adjustments are addressed in trend #3.
The third reason for this down-shift in economic growth is that the kinds of goods and services dominating the U.S. economy over the past 15 years are difficult to quantify.
That’s because most of their value is qualitative and subjective. For example, smart phones have added immeasurably to our quality of life by replacing landline phones,
GPS devices, televisions, phonographs, calculators, personal computers, books, newspapers, magazines and myriad other devices.
They’ve also enabled whole new sources of value like social media and e-commerce platforms.
However, these new products don’t add to GDP in the same way as the products they replaced.
That’s because post-millennial innovation has transformed what were formerly physical products or paid services into ad-supported digital services which appear to be “free.”
And these often don’t show up in GDP.
However, it appears that America is on the verge of a transition away from growth in “qualitative intangibles” and back to more “quantifiable value.”
That’s because the new drugs, materials, machines, processes and services enabled by AI will drive new production and related revenues which actually show up in GDP.
Now, let’s examine the claim that U.S. “income inequality continues to rise at an alarming rate.”
The Congressional Budget Office calculates the Gini coefficient to estimate the income gap between higher-income and lower-income households.
(A chart capturing this relationship appears in the printable Trends issue.)
However, there are two different measures that are commonly used in this calculation, and they give different answers regarding trends in inequality.
One is so-called “market income” based on pre-tax numbers and the other is “income after taxes and transfers.”
For measuring inequality, income after taxes and transfers is the only metric that makes sense.
Unlike market income, income after taxes and transfers is a comprehensive measure of living standards which considers the impact of taxes and social safety net transfers on people’s real economic well-being.
Based on income after taxes and transfers, inequality increased 7 percent in the 30 years from 1990 to 2019.
However, the entire rise occurred from 1990 to 2007. On the other hand, inequality decreased by 5 percent since 2007 when political and media attention to inequality peaked in response to the Great Financial Crisis and the Occupy Wall Street protests.
In short, U.S. income inequality has actually been shrinking over the past 16 years.
Another popular assumption is that “current debt levels are unmanageable” and this will lead to catastrophic problems in the years ahead.
Do the facts support this assertion?
Let us first consider the state of U.S. household balance sheets.
Private sector net worth now stands at a record $154.3 trillion, al most double what it was just 10 years ago.
Even after adjusting for inflation, we find that the net worth of U.S. households has been increasing at an average rate of 3.6% per year since 1952.
That works out to a 12-fold increase in just 70 years.
Critics would say, “the population has also increased a lot over that same period.”
However, if we look at inflation-adjusted per capita data, we find that the living standards of the average American have increased by a factor of almost 6 in the past 73 years.
On the other hand, it’s outrageous that our Federal debt as a percentage of GDP is roughly 124%.
However, it’s worth noting that this figure previously soared to 119% at the end of World War II, just as the great post-war boom was about to begin.
From there, it fell to a low of about 32% in the mid-1970s and rose to just over 55% in 2001.
The current peak developed in the wake of stimulus related to the Great Financial Crisis and the Covid pandemic.
While 124% is high, that debt has only become risky since the Federal Reserve recently raised rates, driving up the government’s debt service costs.
And even then, only about 23% is owed to non-U.S. entities, so it simply provides a risk-free place for U.S. citizens, companies, and agencies to park their money.
More importantly, because this debt is denominated only in U.S. dollars, the Federal government does not face the default risk most other countries’ face with their sovereign debt.
Furthermore, America’s economic and geopolitical advantages, mean that its GDP is likely to grow faster than government debt in the decades ahead, bringing this ratio down.
On the other hand, the private sector does have a non-zero chance of insolvency or default at some point.
But the good news is that the private sector has de-leveraged by about 40% since 2007!
That means private sector debt as a percentage of GDP is now back down to where it was in the early 1970s.
Based on the foregoing, there is little, if any, reason to worry about U.S. debt levels.
Nevertheless, we need to avoid borrowing to fund counter-productive priorities.
Next, let’s consider whether “the link between productivity and worker pay is broken.”
The simple answer is “No! It isn’t.”
You might have seen some version of the chart in the printable issue titled, “Hourly Wages and Output per Hour.”
It shows a massive long-term divergence of five-to-one between productivity growth and wage growth.
However, this chart is highly misleading.
In a recent research paper titled “The Link Between Productivity and Wages Is Strong” Michael R. Strain of the American Enterprise Institute focuses on another chart which tells a radically different story about productivity and pay.
It shows that productivity growth and wage growth move together decade-after-decade.
Here we see some modest divergence since 2000, but nothing like the disconnect seen in the first chart.
The fact is the second chart more accurately reflects economic reality in its basic conceptual choices.
First, it defines output as net output rather than gross output.
Productivity calculated based on net output per hour of work makes sense since it removes capital depreciation.
As Strain observes, “Since depreciation is not a source of income, net output is the better measure to use when investigating the link between worker compensation and productivity.”
Second, it’s better to include non-wage compensation, including health benefits, rather than just wage compensation given that non-wage compensation has risen as a share of total worker compensation.
In contrast to the current narrative in some policy circles, this analysis makes clear that the link between productivity and wages remains strong.
As a result, there is little reason to argue that American workers, on average, are being short-changed relative to their contribution to the system.
Another popular canard is that Worker wages have gone nowhere for decades.
The most common version of this claim is that “since the 1970s, real wages haven’t gone up much at all.
In fact, some pundits argue that wages may have only risen 5% over the past five decades of American economic history.
And this leads to a highly misleading claim of widespread “stagnation.”
The truth is that, from the peak of the 1990 business cycle through 2019, real wages have actually gone up by 20% as measured relative to the consumer price index and by over 33% as measured relative to the price consumption expenditure (or PCE) index, according to Strain’s calculations.
Moreover, if we consider how much money peo ple have after taxes and transfers, the stagnation argument looks even more dubious.
Consider five key facts the CBO noted in its recent look at incomes from 1979 through 2019:
First, over the 41 years, every income group saw its highest average “income after transfers and taxes” in 2019.
Second, income growth after transfers and taxes was fastest for top earners; however, it was pretty comparable across the entire distribution due to progressive taxes and safety net transfers.
Third, after transfers and taxes, the lowest quintile’s income grew 94 percent – or 1.7% annually.
Fourth, after transfers and taxes, the middle three quintiles’ income grew 59 percent – or 1.2 percent annually. And,
Fifth, after transfers and taxes, the highest quintile’s income grew 123 percent or 2.0 percent annually, reaching $252,100 in 2019 versus $113,100 in 1979.
An important factor was that the average federal tax rate for top earners decreased, resulting in slightly faster growth in income after taxes.
And that brings us to the nearly ubiquitous claim that upward mobility is a thing of the past.
The truth is that upward mobility is still happening. But it’s less obvious than it was 50-to-100 years ago.
To understand, ask yourself, “Are people doing better in their 40s than their parents were doing during their 40s?”
Overall, research shows that around 73 percent of Americans in their 40s have higher real incomes than their parents did.
And for kids raised in the bottom 20 percent, that number is 86 percent.
However, it has become less likely that someone will be able to move up from a lower quintile to a higher quintile.
That’s different than simply being better in absolute terms.
As explained in prior Trends issues, much of this difference is due to a divergence in lifestyle attributes between people born into the five income quintiles.
For example, research from the Brookings Institution shows that graduating from high school, getting and keeping a job, staying out of jail and not having a child until married can virtually ensure a life free from poverty.
Beyond those metrics, having two parents at home correlates strongly with upward mobility.
However, those are values not often mimicked by friends and family in the bottom two economic quintiles.
The influence of peers largely explains why those at the bottom disproportionately stay at the bottom, while the same is true for the top.
What’s the bottom line?
The foregoing analysis demonstrates that things are better than most Americans and economic pundits believe.
However, things could be better still. Investors, managers, and policy-makers must remain vigilant if we hope to make things even better for ourselves and future generations.
Given this trend, we offer the following forecasts for your consideration.
First, in the coming decade, real U.S. economic growth will return to the 3.1% trend it enjoyed prior to the Great Financial Crisis.
This will be made possible by the AI-driven productivity revolution described in trend #2, coupled with talent migration discussed in trend #4.
Second, the biggest threat to America’s coming resurgence involves the continued regulatory overreach discussed in trend #3.
Resources now devoted to compliance with obsolete and counter-productive regulations will be reallocated to productivity enhancing priorities.
This should quickly eliminate the cumulative regulatory drag on economic growth over the past 40 years raising GDP growth rates by at least 1% a year, in perpetuity.
Third, North America’s growth will benefit enormously from today’s global demographic crisis during the 2020s.
The new Cold War will increasingly limit the global flow of resources and technologies, creating a powerful down-draft for economies in the de-facto Sino-Russian alliance.
Meanwhile, the workforce in most European and Asian countries is rapidly aging and shrinking limiting their growth possibilities.
So, as re-shoring and friend-shoring accelerate, the “best and the brightest” will be drawn to where they see the most upside and that will typically be North America.
Since, assimilation is a key competitive advantage of the United States and Canada, they will be able to take advantage of the world’s increasingly mobile talent pool as explained in trend #4.
Fourth, absolute income inequality is likely to increase slightly as a premium is placed on talent and merit.
However, the shortage of skilled blue-collar talent means that percentage gains will be greatest in those job categories.
Fifth, as the AI-driven productivity boom takes off, the national debt will shrink as a percentage of GDP.
This surge in GDP will increase tax revenues reducing the deficit.
And as we saw in the 1990s, a tech driven boom may even create a budget surplus.
Combined with lower interest rates, these factors will make servicing the national debt easier than it is today. And,
Sixth, total worker compensation will continue to keep pace with productivity, even as profit margins in most industries expand.
Because of the increased contribution of technology to profits, shareholder returns will accelerate.
However, these gains will not come at the expense of workers.
Resource List
1. Faster, Please! September 4, 2023. JAMES PETHOKOUKIS. What is the outlook for long-term US economic growth?
2. Seeking Alpha. August 30, 2023. Scott Grannis. Is This A Great Country Or What?
3. Seeking Alpha. August 30, 2023. Scott Grannis. 2% Growth And 2% Inflation: The Fed’s Done.
4. Faster, Please! August 21, 2023. JAMES PETHOKOUKIS. Four shocking truths about the American economy! (Well, shocking to some.)
5. Trends. October 11, 2014. Trends Editors. America’s Slow, Painful Techno-Economic Transition.